The BIA System Boundary — Where the Data Runs Out
A Sankey diagram tracing relative carbon flows across a BIA system's full life cycle. Grey zones mark stages the report couldn't quantify from existing literature, and post-farmgate transport is deliberately excluded from every comparison.
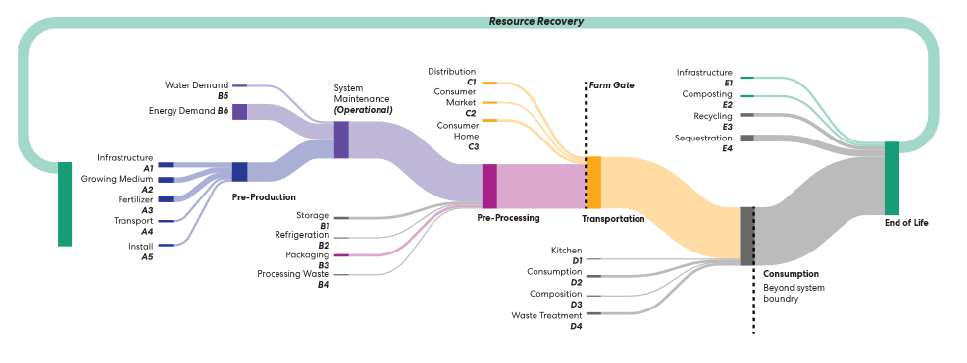
BIA system boundary and Sankey diagram illustrating relative carbon flows. Grey zones are excluded due to data limitations; post-farmgate transport is not quantified, consistent with the BIA LCA framework.
This diagram cross-maps ISO 14040's standard building LCA phases (raw material supply, transport, construction, use, end-of-life) against the inventory items reported across BIA literature, it shows where the two systems' data genuinely line up and where they don't. Energy use, water use, and packaging translate cleanly between building and BIA life-cycle phases. But most other categories don't: no study reviewed for the report included embodied carbon values for the installation stage, and there were insufficient data points across the literature to report embodied carbon from storage, refrigeration, or processing waste, partly because many BIA operations don't process product on-site, and partly because studies scoped their inventory only to the physical production space itself. Rather than paper over those gaps with estimates, the report greys them out directly on the diagram. Post-farmgate transport is excluded from the boundary entirely and on purpose, kept consistent with the BIA LCA framework in Table 32, so that every farm-type comparison elsewhere in this chapter is being measured against the same edge of the system, not a different one for each study.
From the Report:
Part V, "Rethinking Boundaries: Unifying LCA Perspectives."